InstCombine Debugger
https://xuhongxu.com/instcombine-instrumentor/
See Every Rewrite InstCombine Makes — In Your Browser
LLVM’s InstCombine is the workhorse peephole pass: it rewrites IR thousands of times per compile, but when one of those rewrites surprises you, finding out which rule fired, why, and on what value usually means a local LLVM build, printf debugging, and a lot of patience.
Recommended Reading:
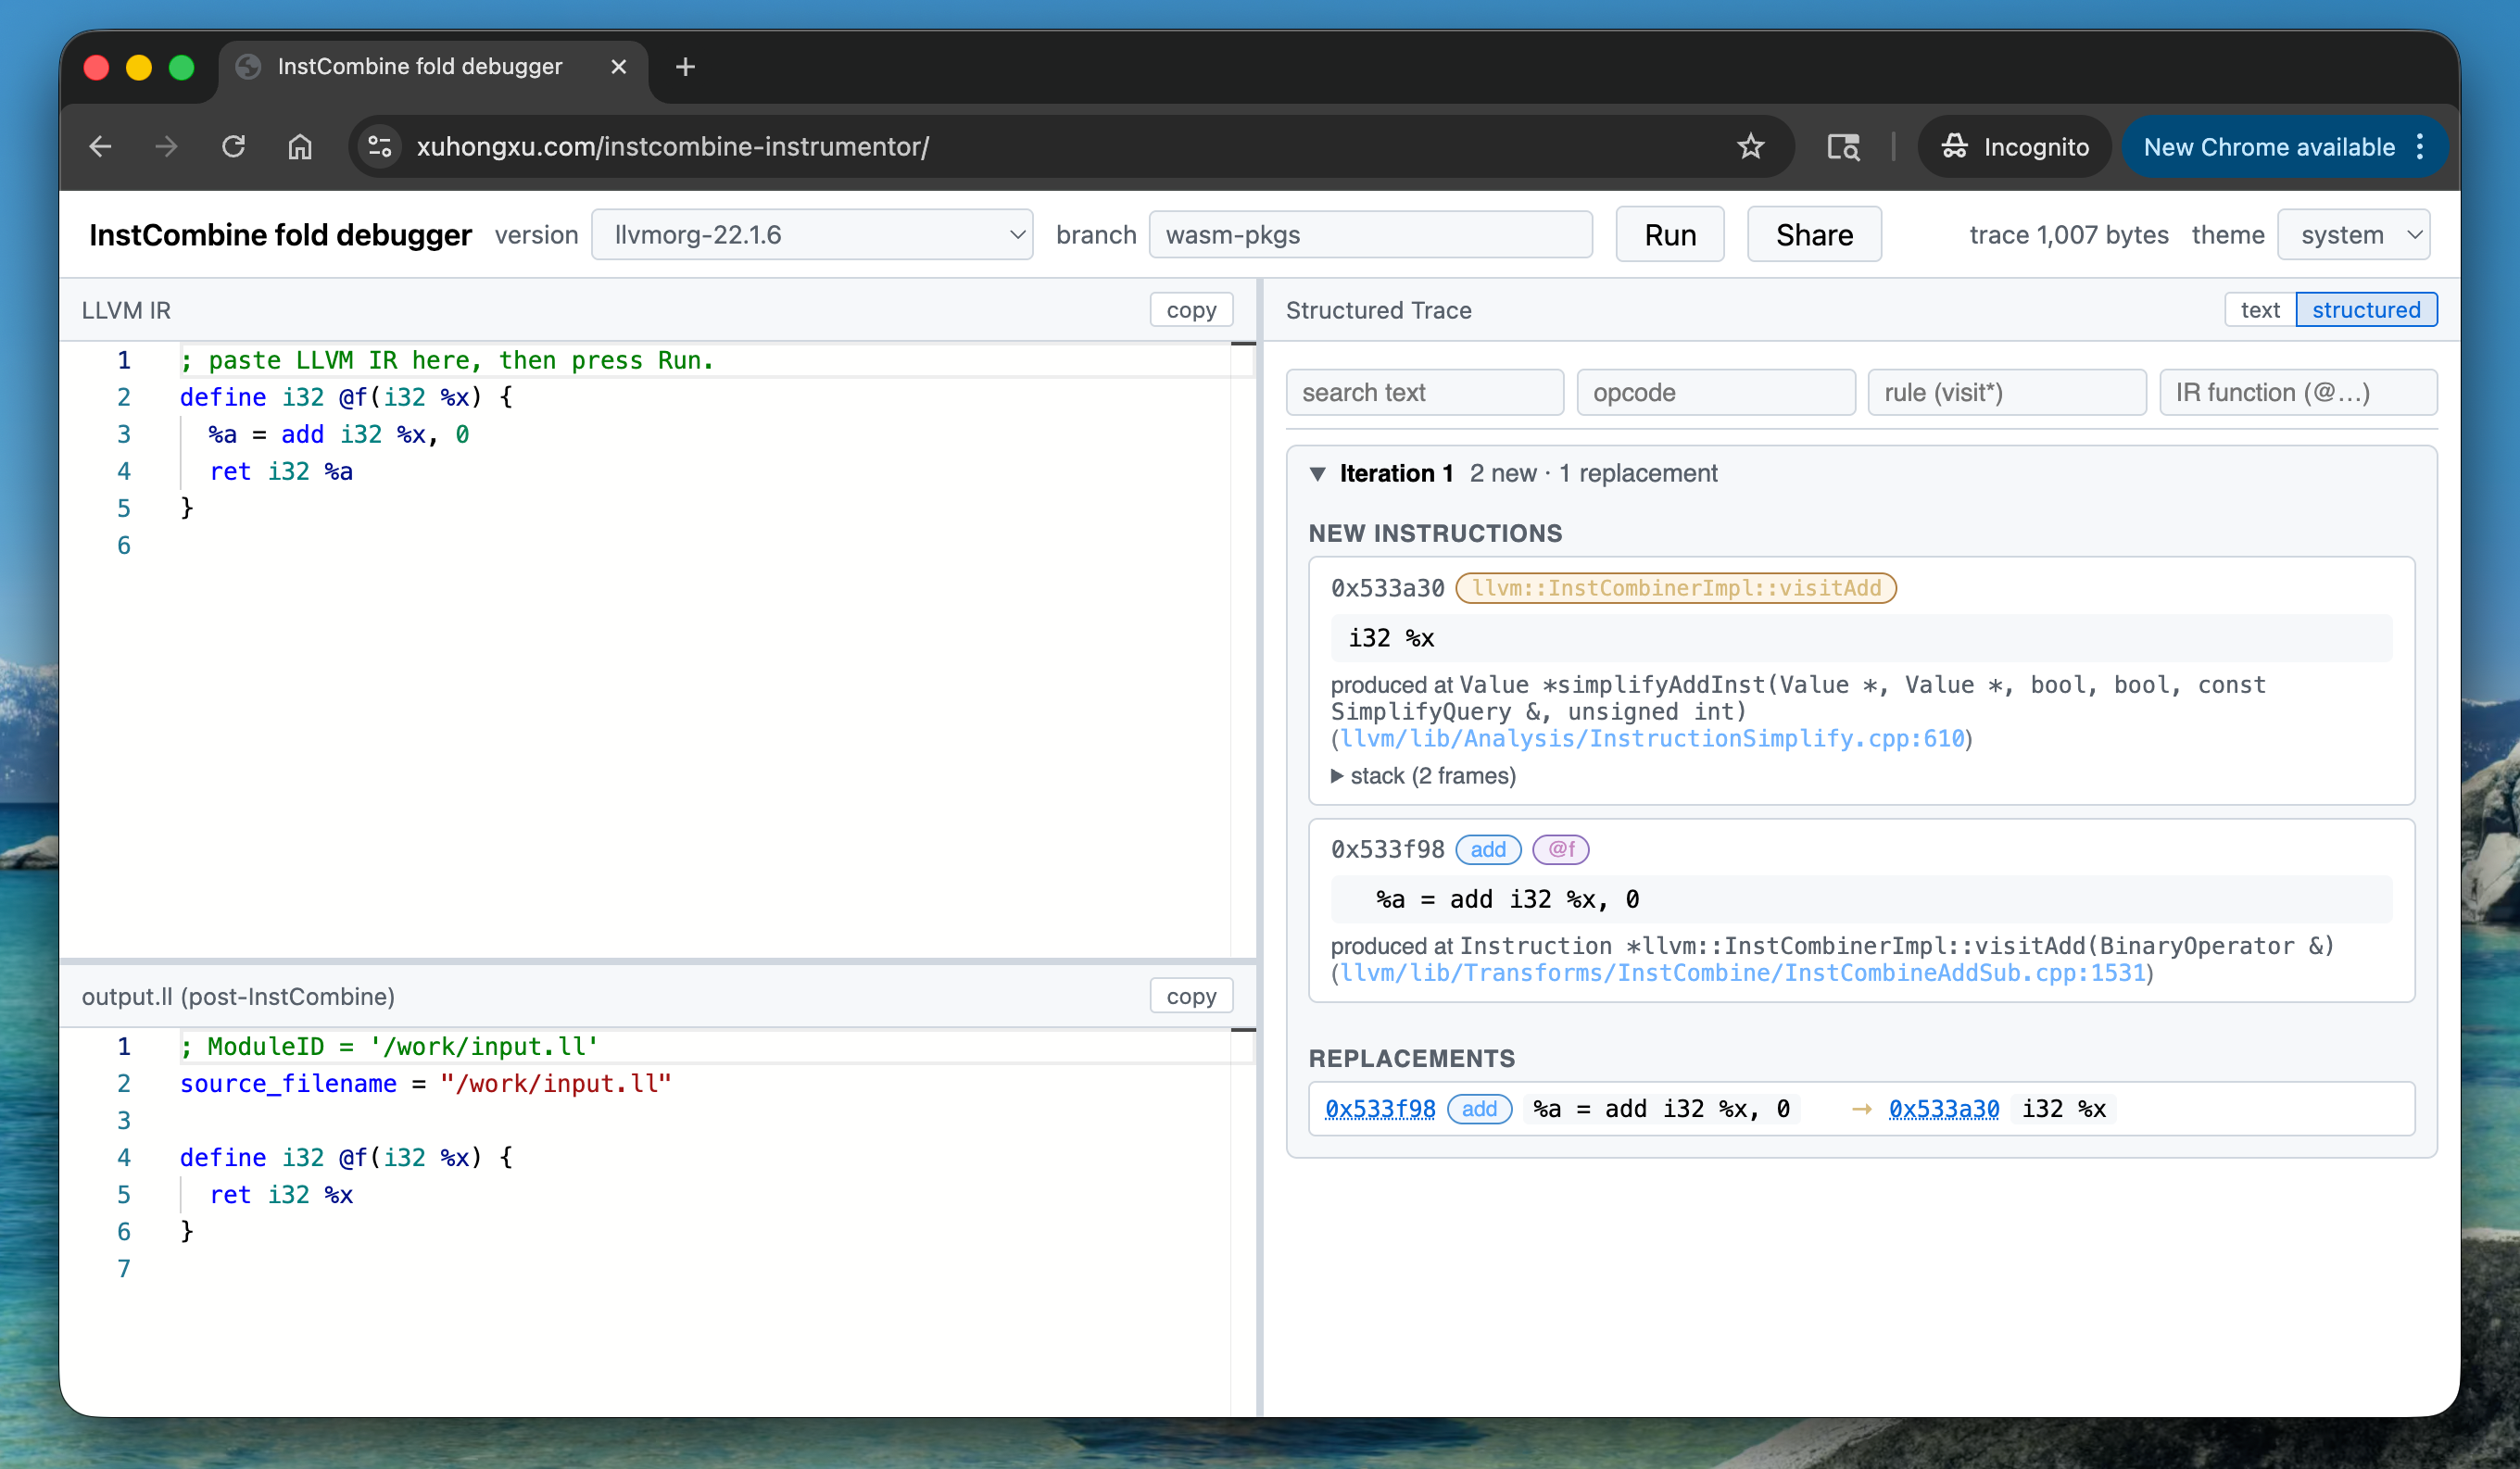
InstCombine Instrumentor is a browser-based debugger that skips all of that.
Paste IR, hit run, and see exactly what InstCombine did to it — instruction by instruction, iteration by iteration.
What you get
- Input IR — paste any LLVM IR .ll snippet
- Output IR — the IR module after InstCombinePass runs.
- Trace — every new
Value*created and every RAUW (ReplaceAllUsesWith) performed, grouped per fixed-point iteration.
The trace pane has two modes:
- Structured (Default) — collapsible iterations, opcode/rule/function pills, filterable by text/opcode/rule/function, with clickable cross-links between replacements. More user-friendly for interactive debugging and exploration.
- Text — each value tagged with opcode, function/BB, rule, and call-site stack. Better for bug reports and offline analysis.
Why it’s useful
- No build. It’s WebAssembly.
The wasm bundle ships with the page; no install, no checkout, no toolchain. - Pick your LLVM.
The version dropdown lists every tagged LLVM release we’ve bundled (Create a pull request to add more). Reproduce a bug against the exact version you’re targeting. - Frame-accurate traces.
Each value is captured at the call site that produced it —__FILE__:__LINE__of the wrapping call, plus the__PRETTY_FUNCTION__of the caller — so you see the rule that fired, not just the leafIRBuilderhelper. - Same trace, native or browser.
We directly patch LLVM’s InstCombine source to emit the trace, so the browser and native builds produce the same output.
Who it’s for
- Compiler engineers writing or reviewing InstCombine patches.
- LLVM contributors triaging “this rewrite looks wrong” bug reports without having to build anything.
- Anyone learning how InstCombine works — watching the fixed-point loop unfold on a small example is the fastest way to build intuition.
Examples
Tip
Try a tiny IR snippet first (a couple of adds with a 0 operand will do), flip to the Structured View, and watch the rules fire.
define i32 @f(i32 %x) {
  %a = add i32 %x, 0
  ret i32 %a
}
; no rewrite in LLVM 21 and earlier
define i1 @src(i8 %x) {
  %lshr = lshr i8 4, %x
  %trunc = trunc i8 %lshr to i1
  ret i1 %trunc
}
; no rewrite in LLVM 21 and earlier
define range(i32 0, 7) i32 @src(i32 %0) local_unnamed_addr #0 {
  %2 = insertelement <4 x i32> poison, i32 %0, i64 0
  %3 = shufflevector <4 x i32> %2, <4 x i32> poison, <4 x i32> zeroinitializer
  %4 = tail call i32 @llvm.vector.reduce.add.v4i32(<4 x i32> %3)
  ret i32 %4
}
Open Source
https://github.com/xuhongxu96/instcombine-instrumentor
Welcome contributions! See the README and CLAUDE.md for details.